Helleniq Energy Holdings S.A., is a Greek company operating in Europe in areas including oil and gas exploration; trading and transport of natural gas; oil refining; and the generation of electricity. Their 2023 report makes good use of interaction design and limited-animation for graphs and charts.
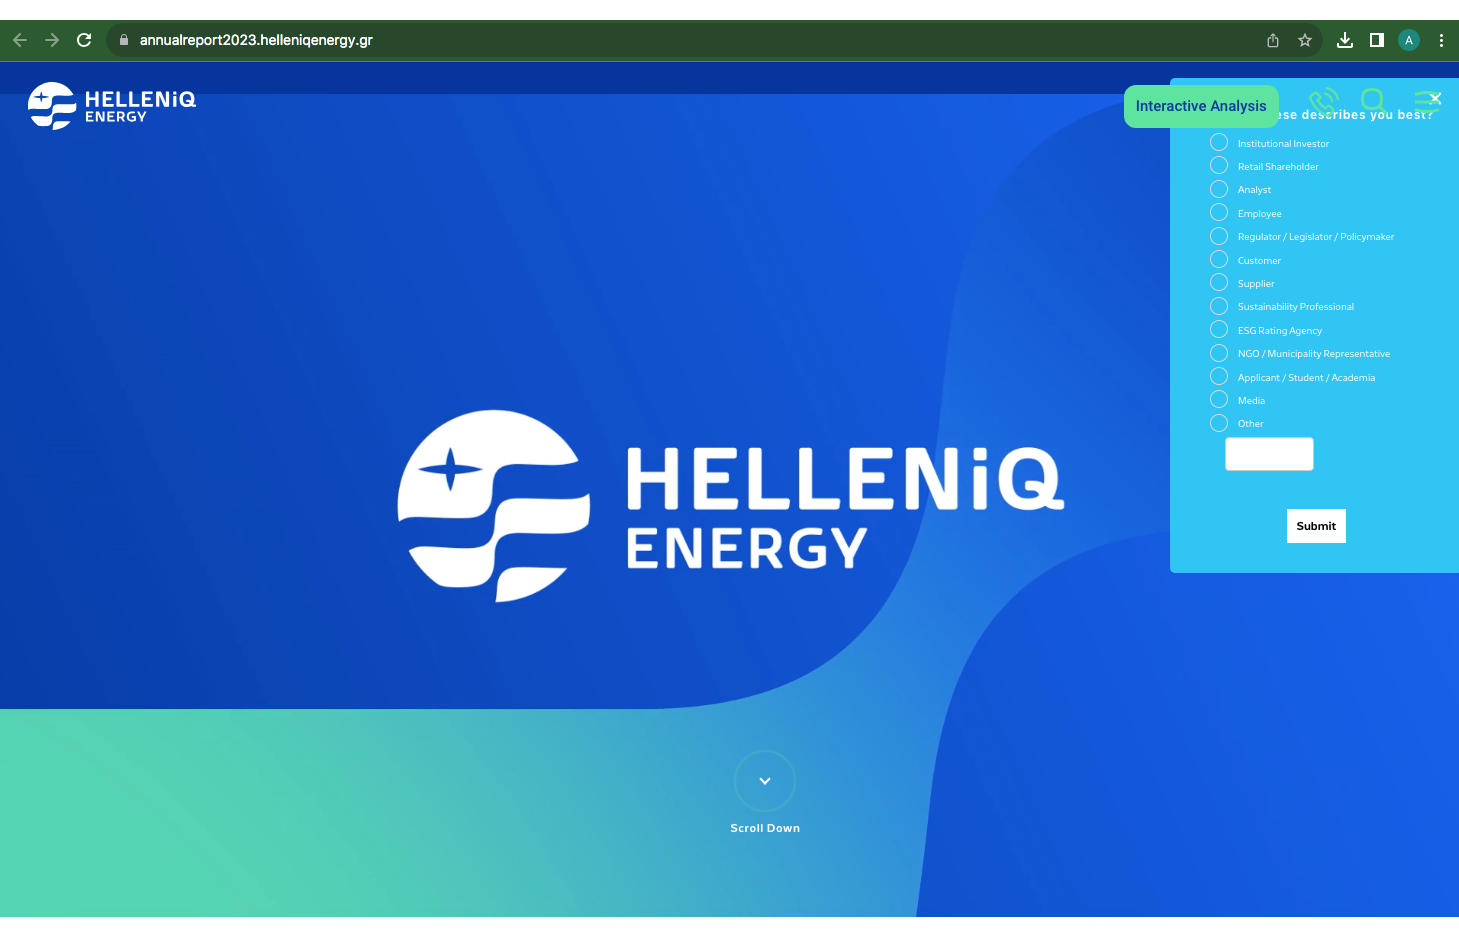
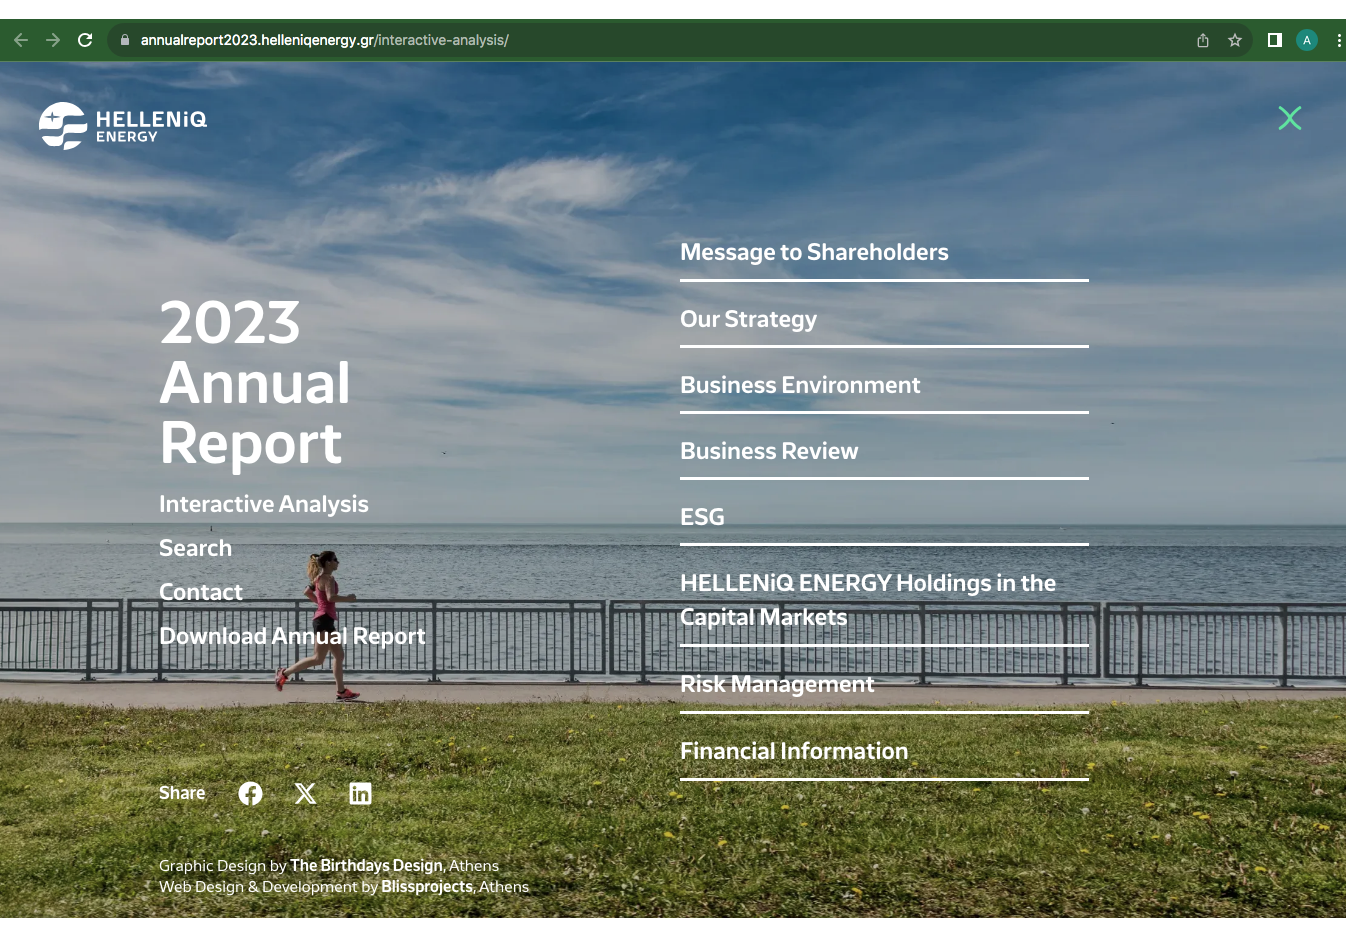
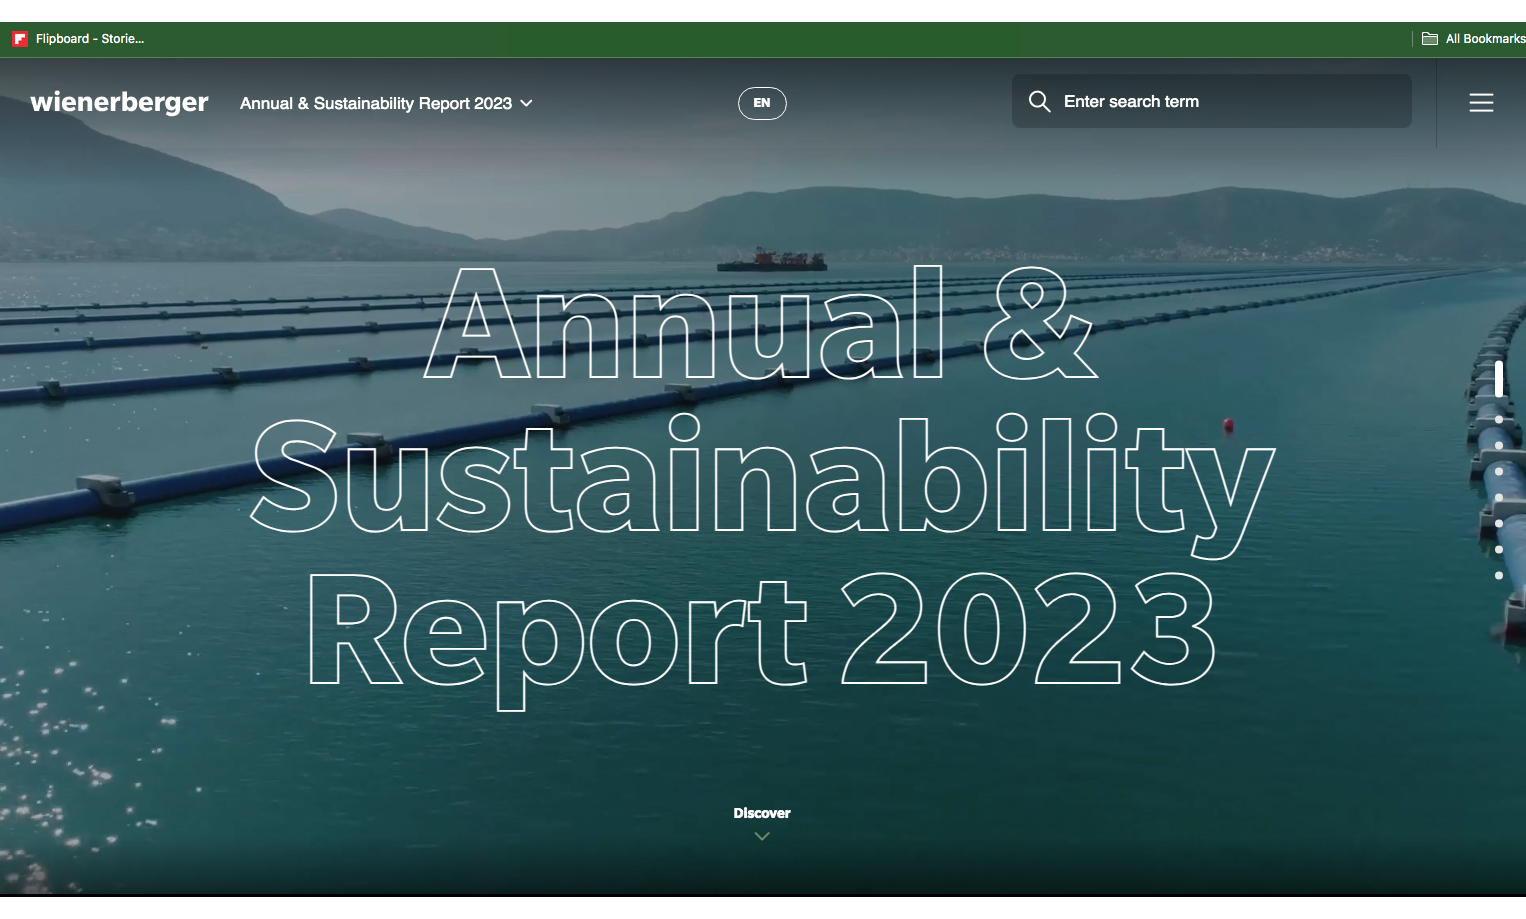
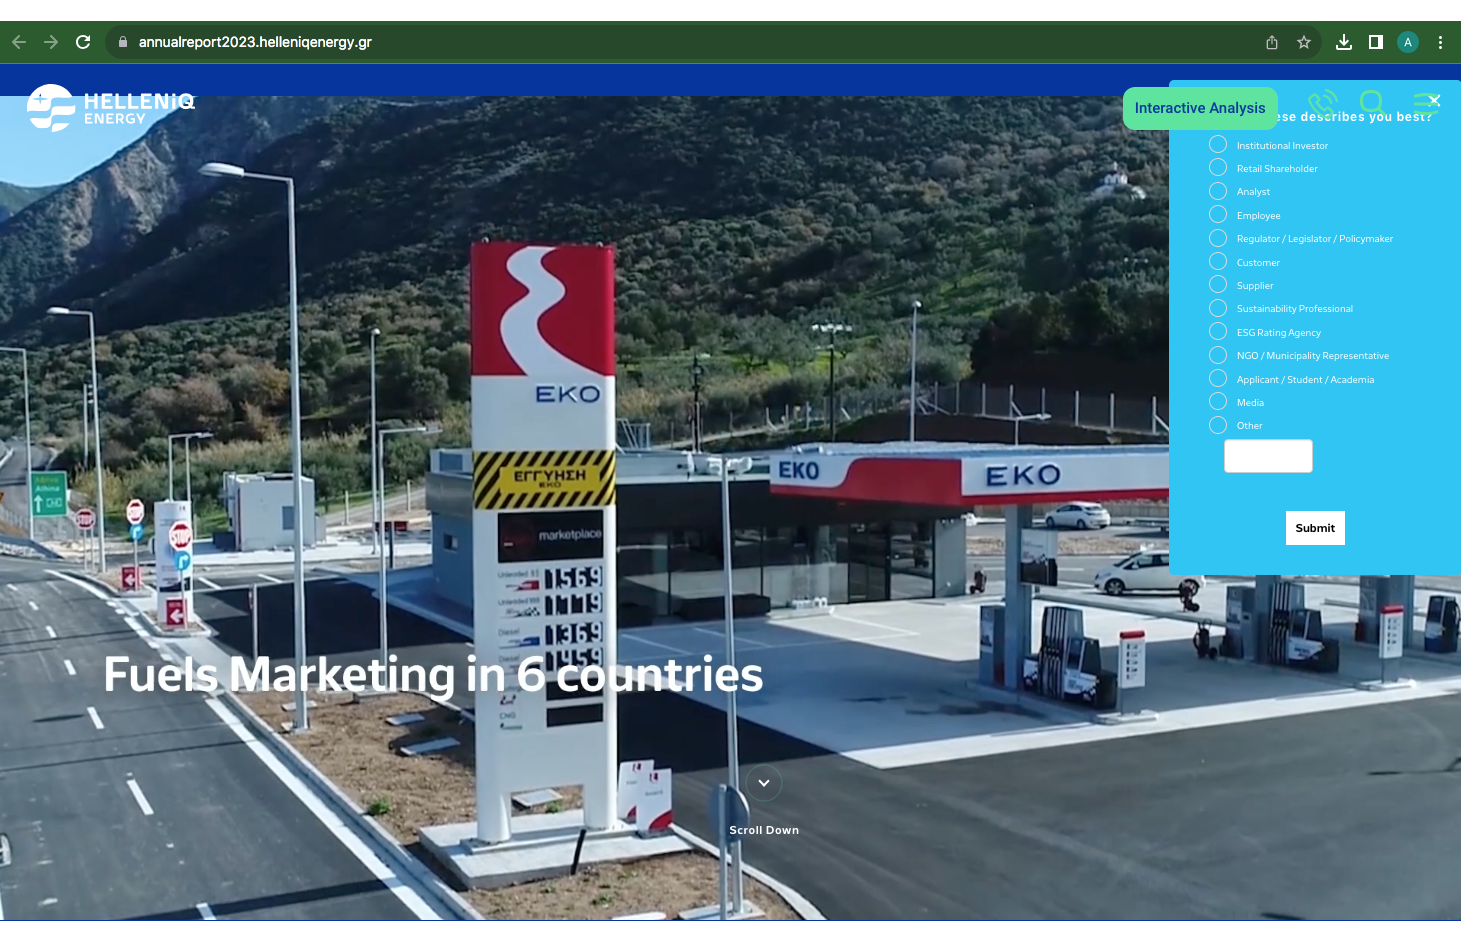
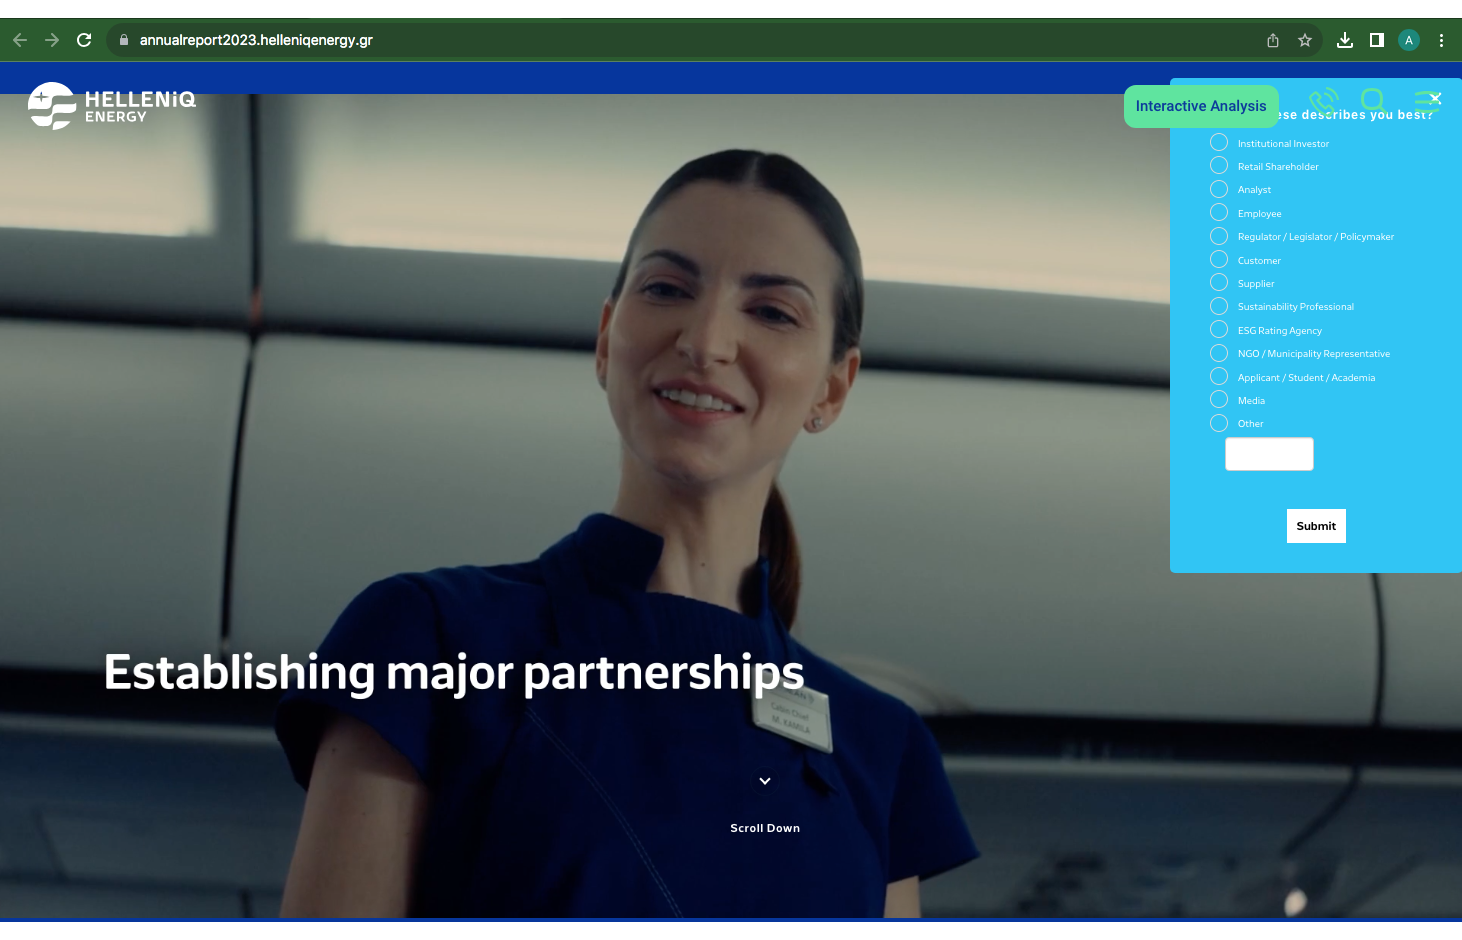
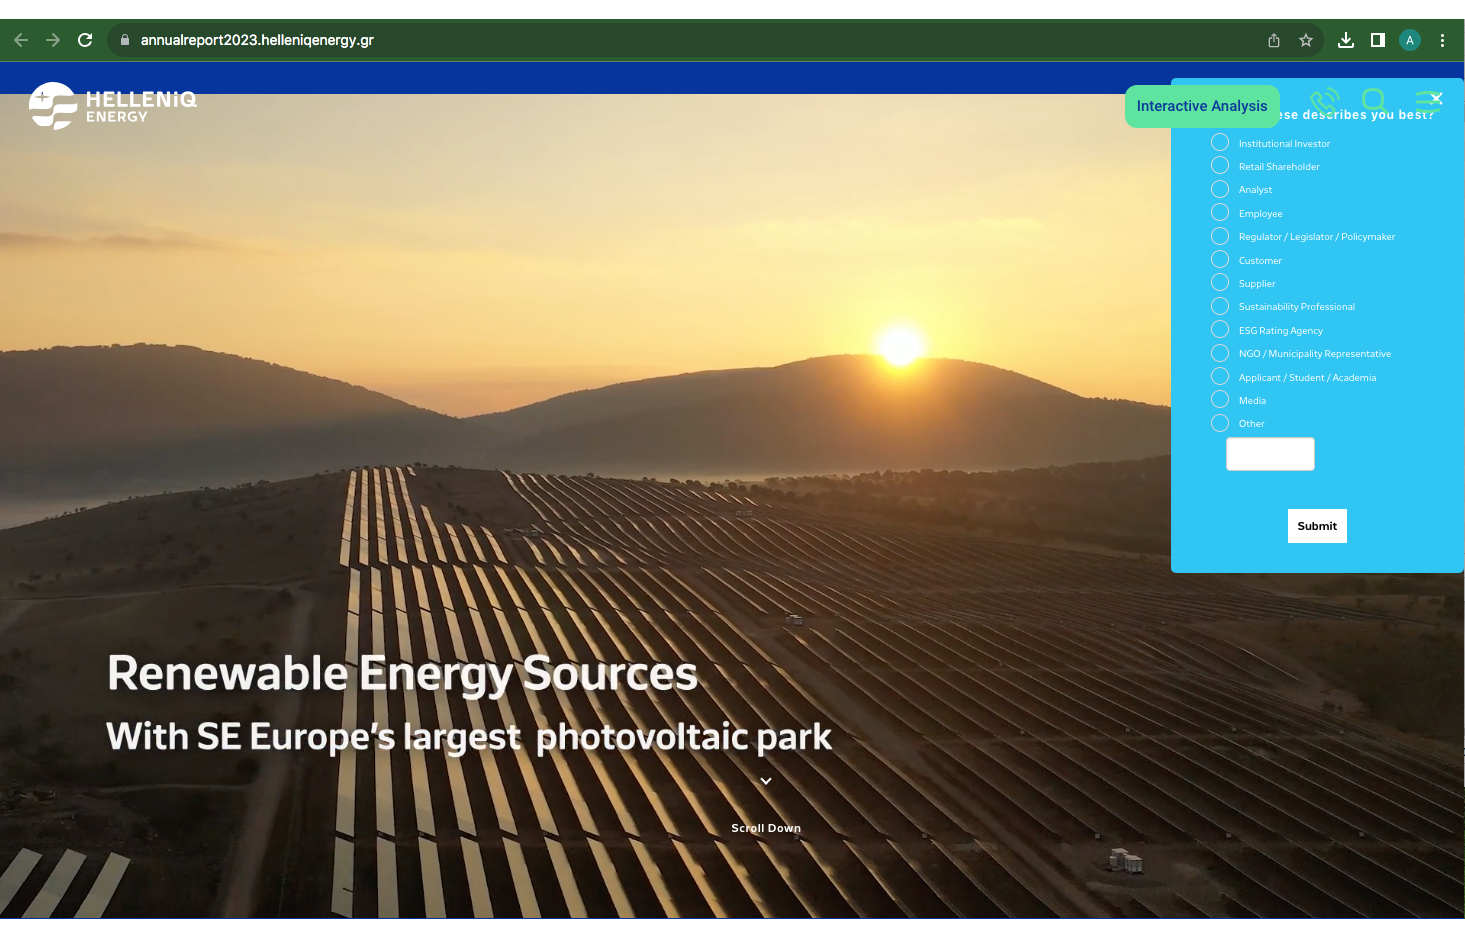
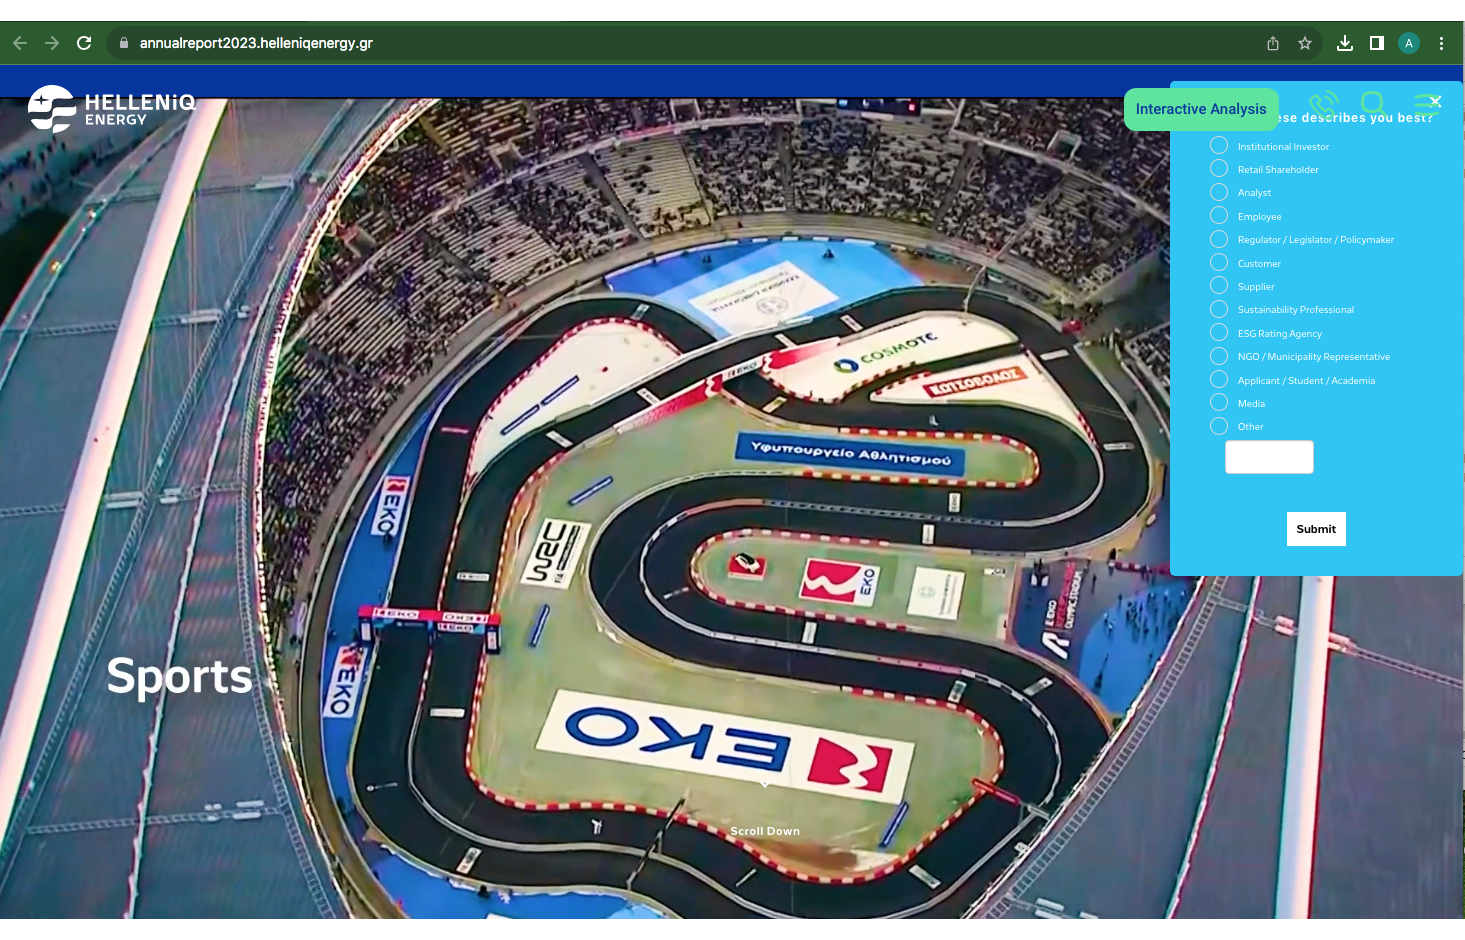
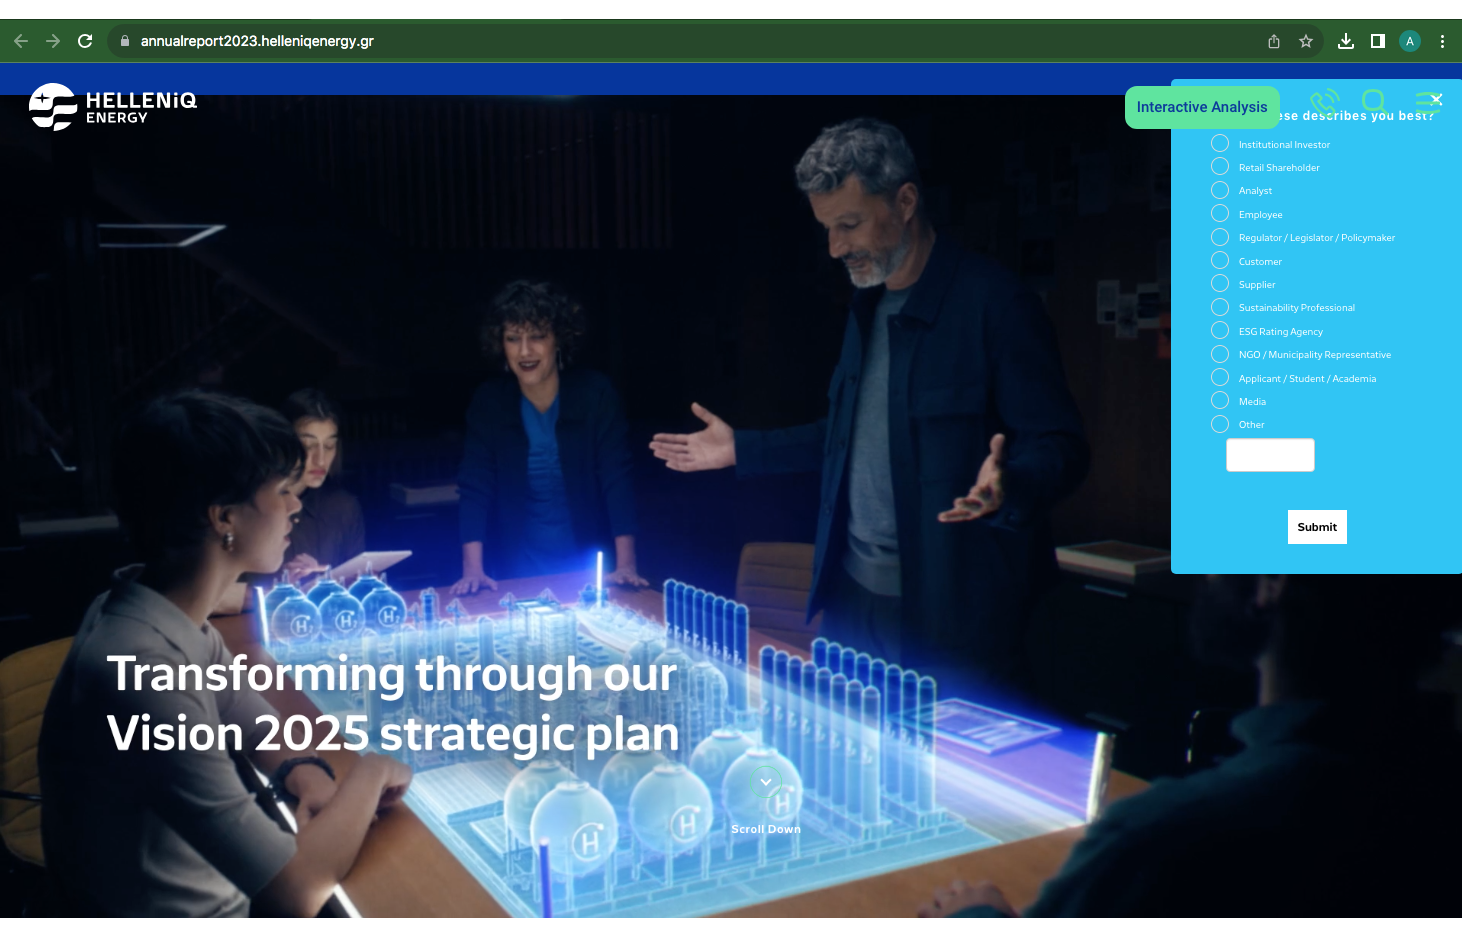
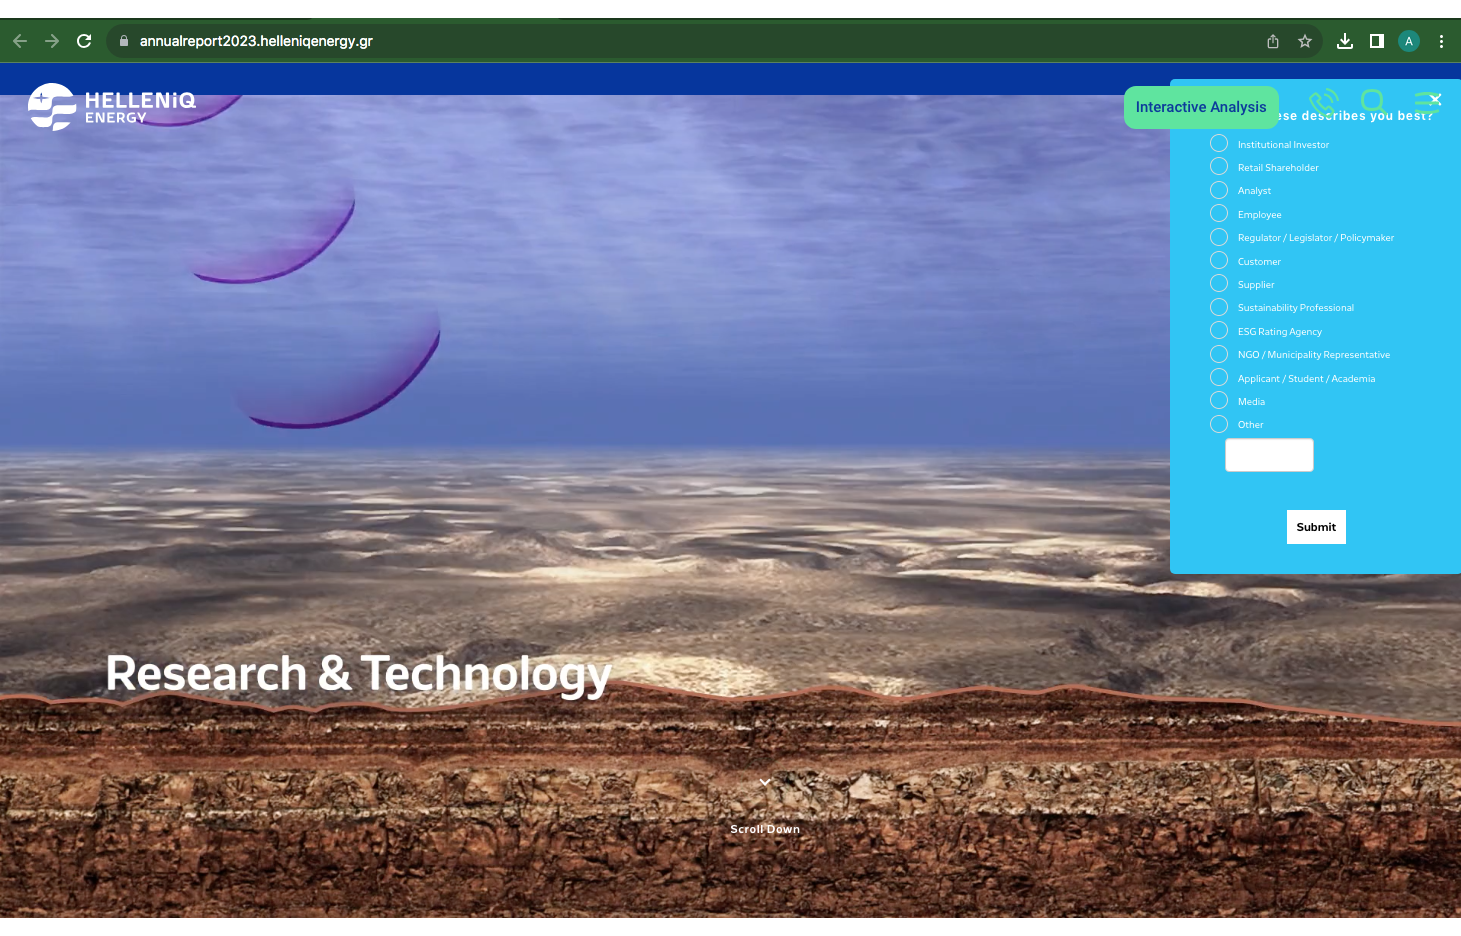
The spine of the report is the landing page, composed of ten sections. These are represented by ten photographs overlaid with brief text summaries. Clicking any of them takes the reader into the relevant section of the report.
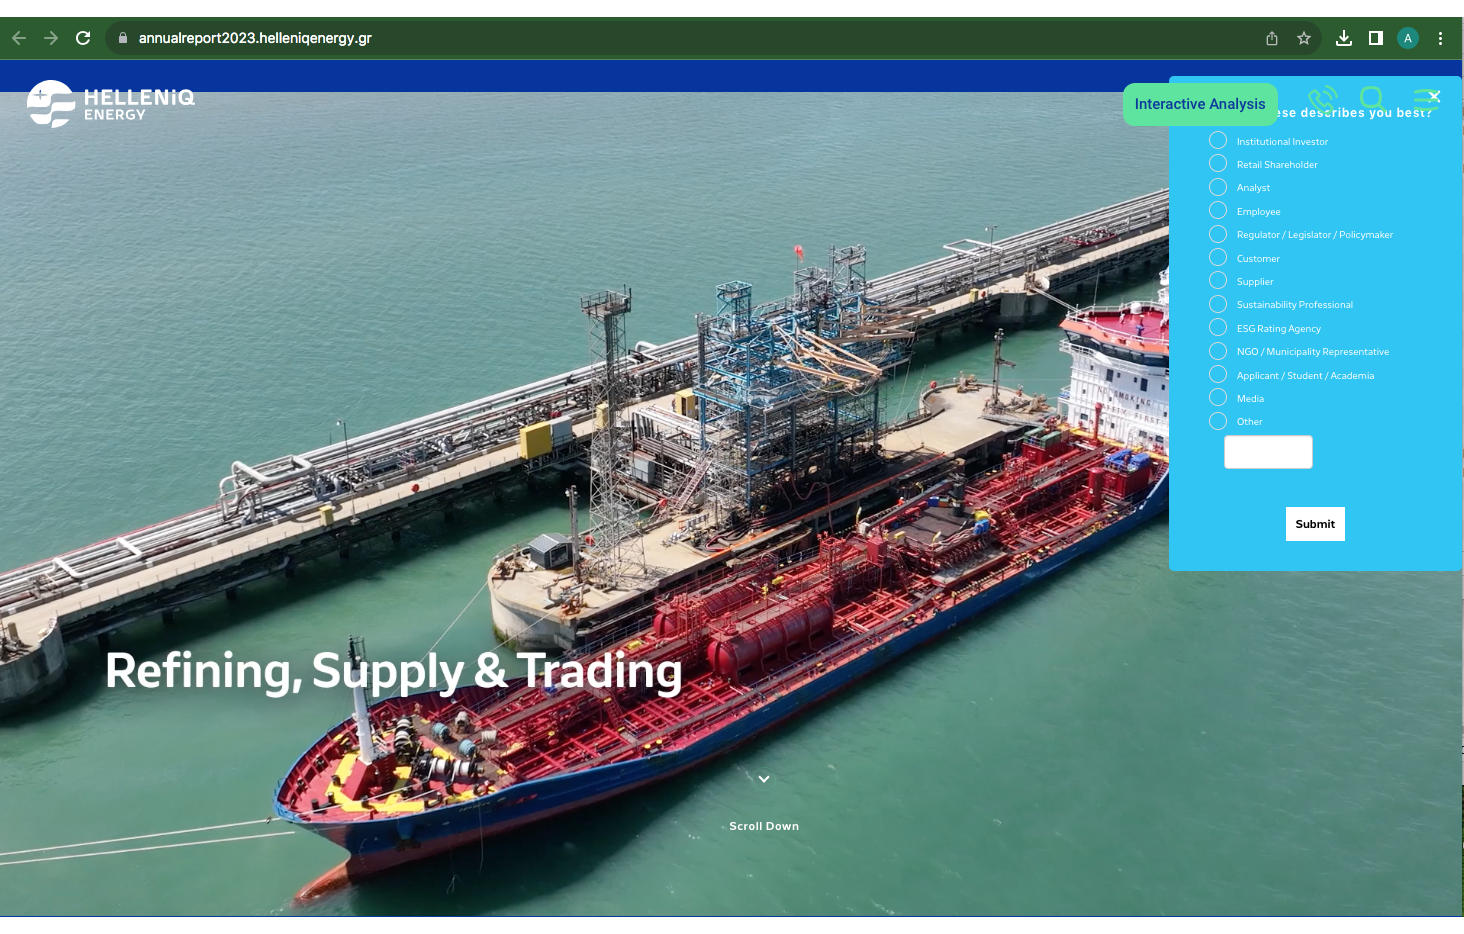
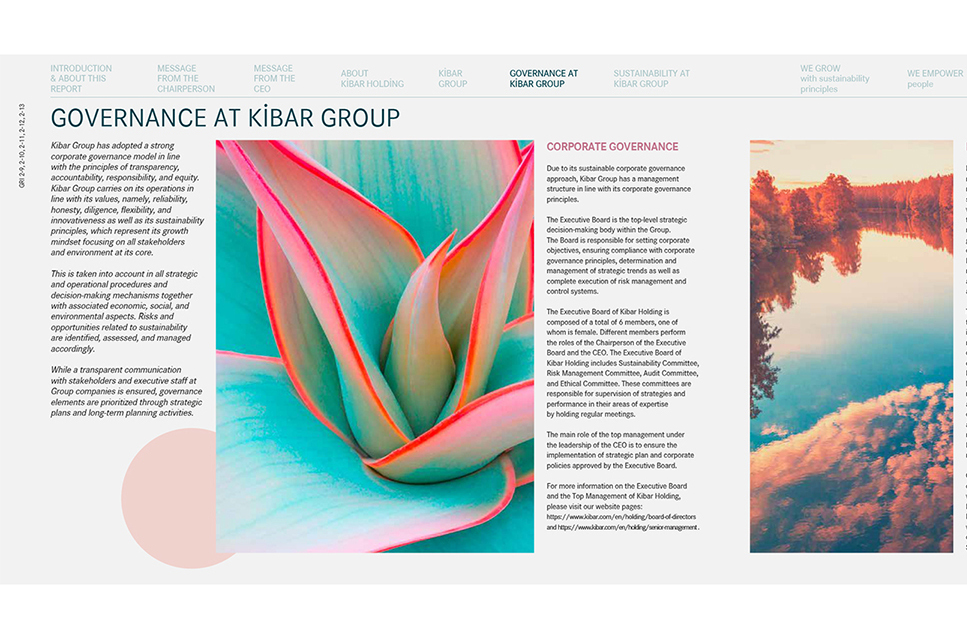
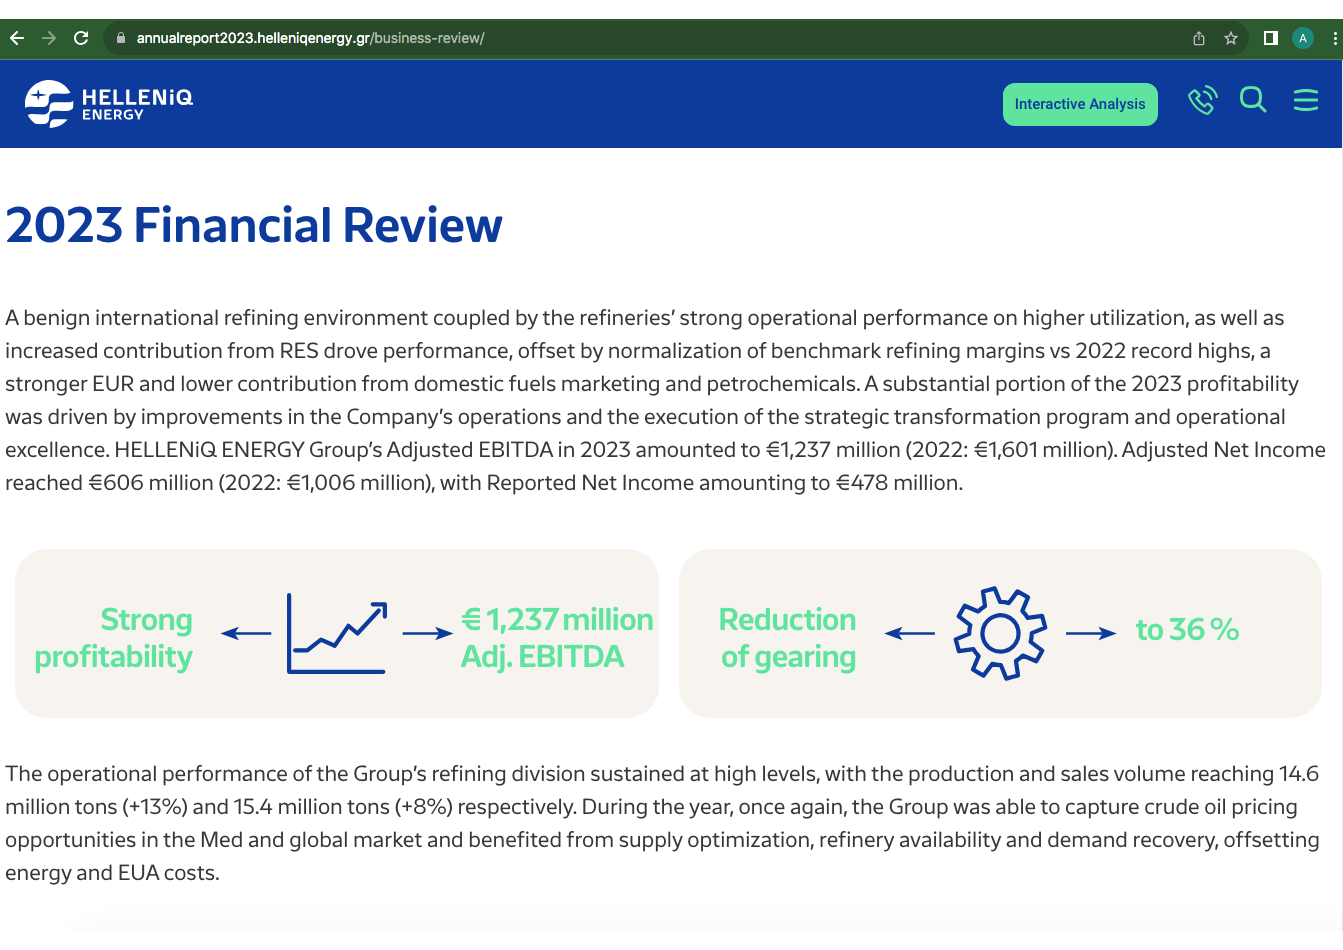
Each section follows a simple, single-column layout accompanied by interactive charts and graphs. Once a reader has clicked through to a section, a navigation bar allows them to move through the report without having to go back to the main page. While this is quicker, you lose the benefit of section summaries and photographs.
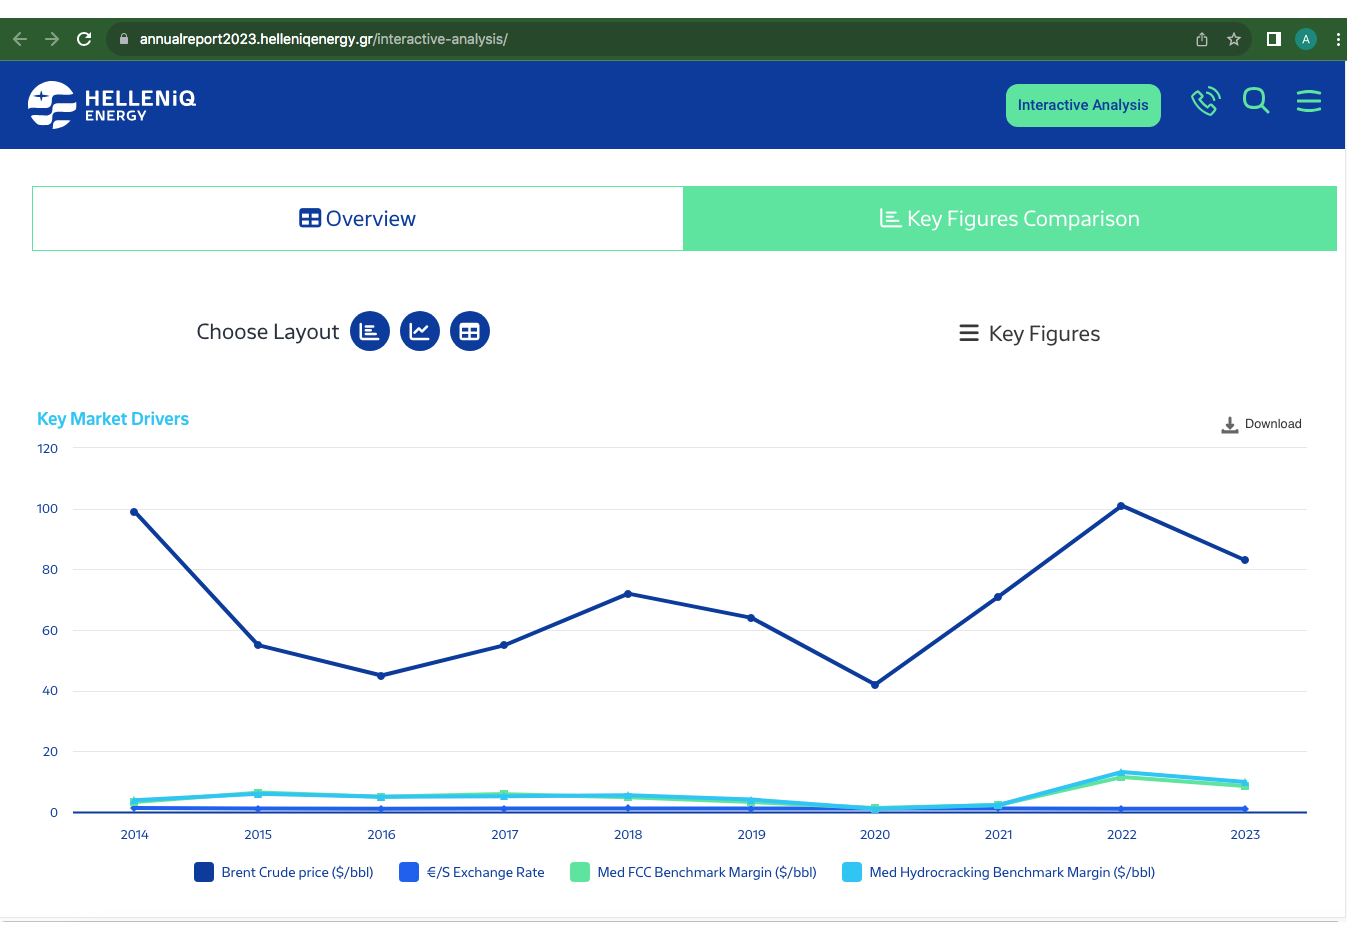
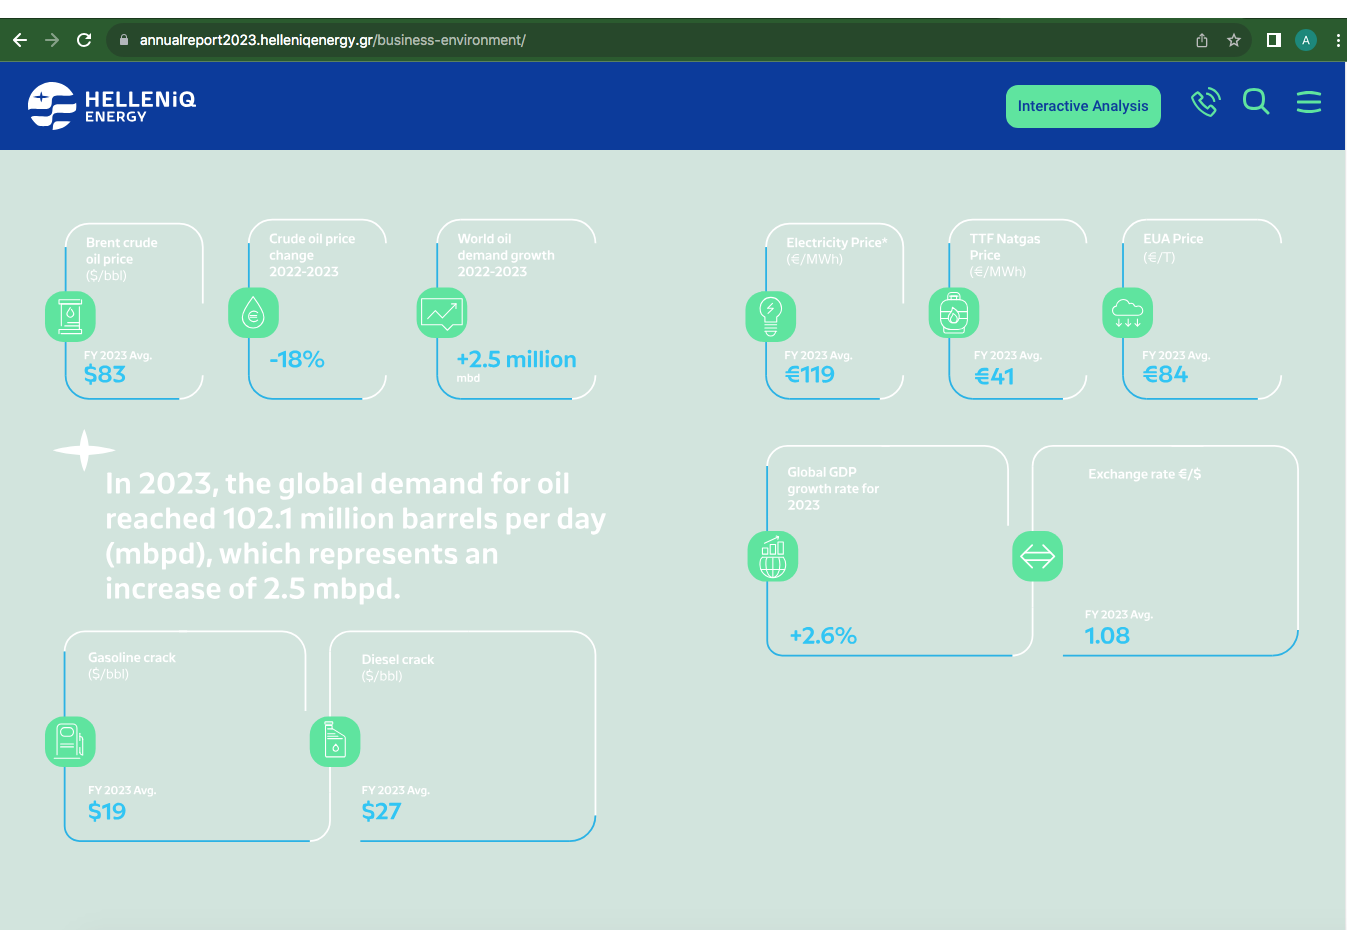
Since the page layout of each section is simple and static, the limited-animation is used to inject motion and liveliness. Graphs draw themselves as the reader watches, making the pages seem dynamic. These self-drawing charts are particularly useful in the linked page titled ‘Interactive Analysis’ in making sense of the data. In this section, the reader can switch between styles of charts and graphs to use the ones they are most familiar with. This is a good touch as it makes use of the flexibility of digital spaces in a way a printed report could not.
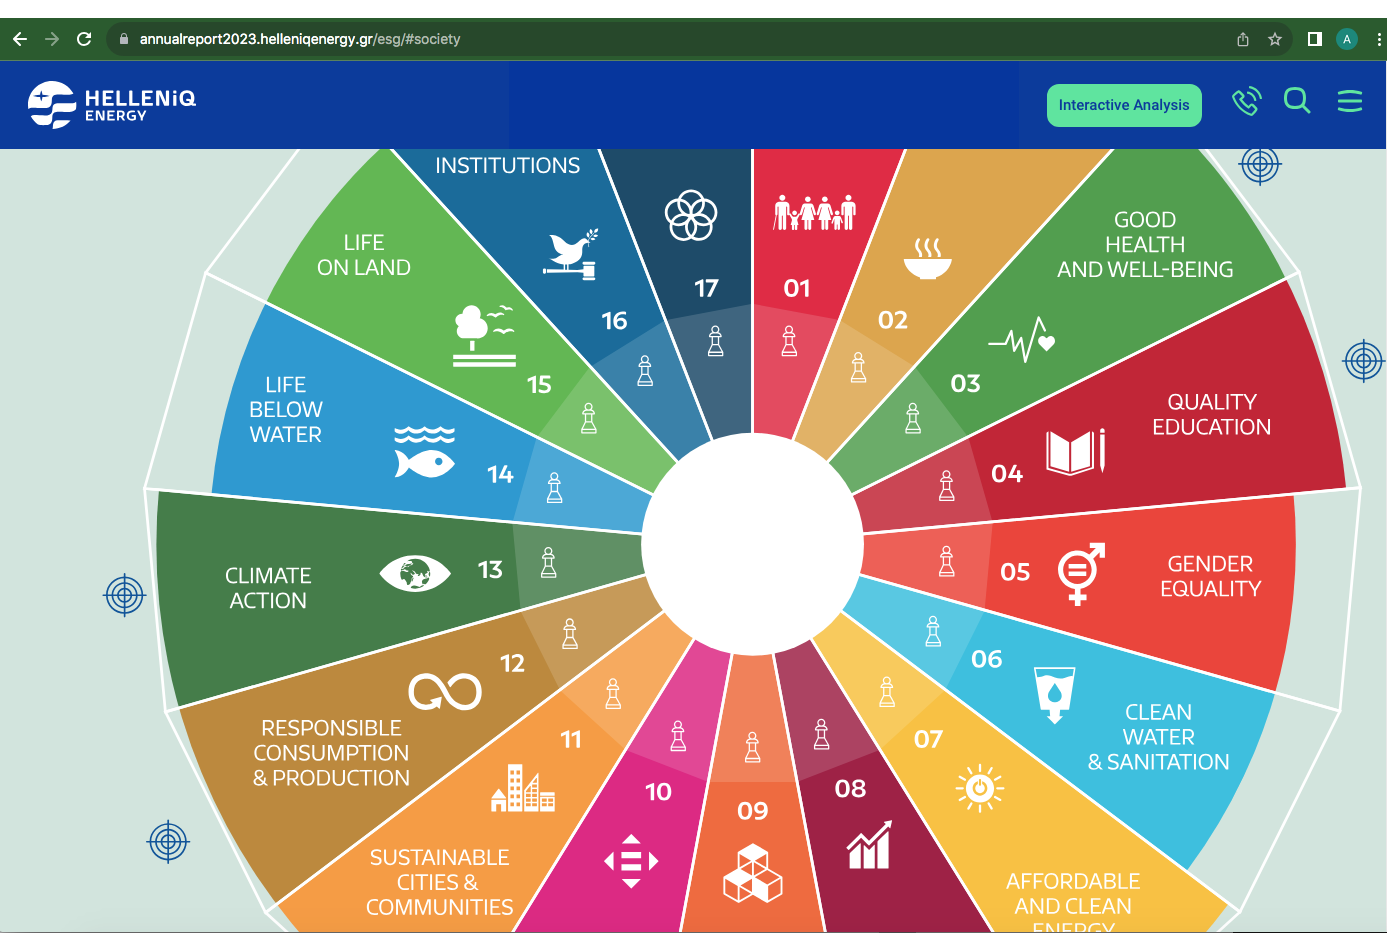
The designers also make liberal use of static icons to represent various aspects of the business: petrol pumps, refineries, electric cars, and so on.
Helleniq’s report features a simple, no-frills design, and engages the reader in its data by making good use of a website to create dynamic charts and graphs.
![]()
![]()